 BRIDGE1

A quality benchmark asks how a model performed on a defined evaluation. A runtime measurement asks about behavior under a stated local workload and configuration. A task result asks whether the selected model and client completed a particular piece of work. These questions can inform the same decision, but their numbers are not interchangeable. Choose the question that blocks your next action before scanning for a larger score.
The benchmarks page distinguishes creator-attributed results from Bridge1’s own published observations. The speed page describes local performance evidence with conditions. Read the row labels before the values. A result can be useful while remaining narrow: it may describe a particular evaluation version, one Mac, one profile or one conversation shape. Retaining those limits is how you decide whether the evidence applies to your intended work rather than to a different experiment.
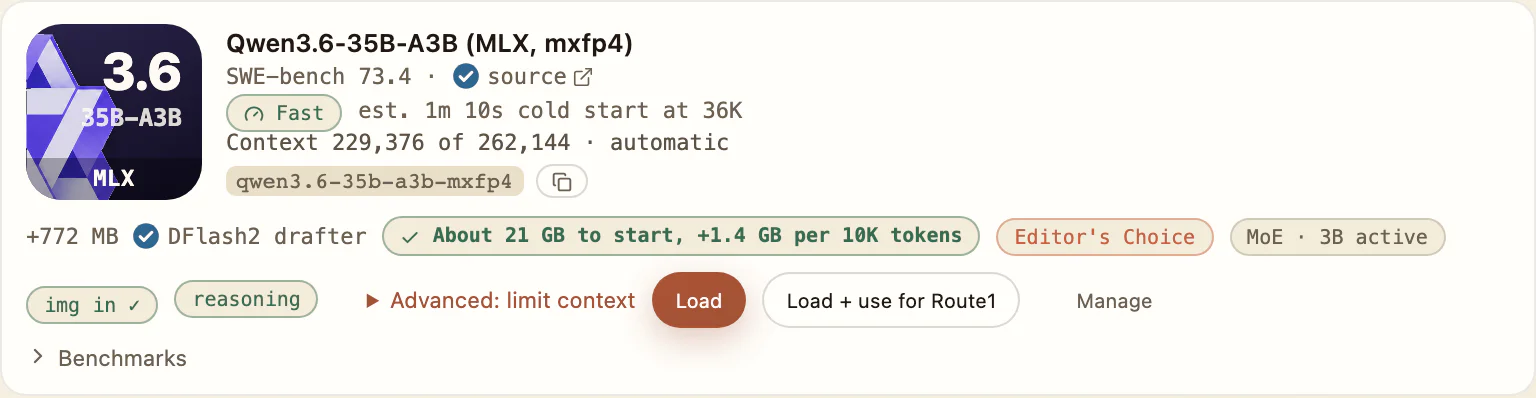
Swipe to see the whole row
The score label links to its source; the cold-start estimate and collapsed Benchmarks disclosure are separate parts of the row.
The benchmarks page identifies Qwen3.6 27B’s SWE-bench Verified 77.2, Terminal-Bench 2.0 59.3 and LiveCodeBench v6 83.9 as creator-reported base-weight scores. The same evidence can appear beside MLX four-bit and GGUF Q8_0 MTP profile rows because it describes the original model, not a fresh evaluation of both offered artifacts. Keep the creator attribution, benchmark version and base-weight boundary attached. These figures cannot decide whether either exact profile completes a tool task in your client.
Keep the benchmark’s version attached as well. A name with a different version or harness is not automatically the same evaluation. A missing score is not a failing score, and an unrelated score cannot fill its place. When the question is whether your selected local profile can edit files in your client, move from the quality evidence to the model guide’s scoped task evidence and then a bounded check. A creator score does not skip those steps.
The speed evidence for Qwen3.8 27B’s catalog checkpoint profile reports 16.98 versus 12.38 tok/s. Its published conditions are M1 Max with 64 GB unified memory, MLX, Experimental, through Bridge1’s own path, with 4 runs per profile. The stated baseline is the checkpoint default profile. Read the complete row on the speed page; these figures are a within-row observation, not a cross-model or cross-Mac ordering.
That row answers a limited runtime question under its stated conditions. It does not supply the time for an arbitrary repository task, a cold start on your Mac or a full conversation at the catalog’s maximum window. It also does not establish a quality improvement. If the prompt shape, output length, conversation depth or cache condition you need is absent from the row, keep that detail unknown instead of inferring it from the throughput value.
The speed page distinguishes prompt reading from generating a reply. A short output can follow substantial prompt reading, especially when the request includes a long conversation. A decode rate describes generation under its conditions; it does not automatically describe the wait before the reply begins. This is why a catalog speed value cannot by itself answer how a long coding exchange will feel in a client.
The benchmarks page’s Cache reuse · Two-turn session record is a separate example: Qwen3.8 27B four-bit MLX on an Apple M1 Max with 64 GB unified memory, one run. The no-cache turn took 359.7 s; the follow-up took 15.8 s and reused 28,722 tokens. These are the two stated turn conditions, not interchangeable samples of cold-start latency. Use the slow-reply article to separate prompt reading from generation, and keep the reuse condition whenever you cite this row.
A result from one run describes that run. Repeated runs can describe variation under the repeated conditions, but the count alone does not establish coverage of other prompts or machines. Check what was repeated: a profile comparison, paired prompts, a conversation shape or a task set. These are different units of evidence. A larger number of repetitions does not make an unrelated workload representative of your own task.
Ranges and uncertainty labels belong beside the result they qualify. Keep an inconclusive finding inconclusive; do not turn it into a win because another number in the row looks favorable. Likewise, a successful task count does not identify which future tasks will pass. The benchmarks page owns its published task conditions. Read them as the boundary of that observation, then choose a separate bounded check for the work you intend to do.
For a useful comparison, ask whether the exact model and precision match, whether the engine and experimental state match, and whether the Mac and memory are the same. Then check workload, prompt and output size, conversation depth, startup state, cache or prediction conditions and repetitions where stated. A missing condition limits the comparison. Do not silently fill it from another row that happens to mention the same model family.
If two rows answer different questions, keep them side by side as different evidence rather than combining them into one score. Quality, memory and latency can all affect a decision without sharing a common scale. The model catalog identifies the offered profiles, while the requirements page states the hardware policy. Neither creates a measured result for an untested Mac. Choose a profile for its documented fit and task scope, then verify the result you actually need.
A missing field is not a failing score. Memory evidence needs its own depth label: for Qwen3.6 35B-A3B MLX mxfp4, Measured to 131,443 tokens (39.1 GB peak, M1 Max 64 GB). The 229,376-token window is estimated at 55.2 GB. For Ternary Bonsai 2 27B MLX: Measured to 65,964 tokens (39.7 GB peak, M1 Max 64 GB). The 81,920-token window is estimated at 53.0 GB. Neither estimated window supplies an observed full-window task result or a minimum Mac.
The same restraint applies to speed values whose conditions are not recorded. Do not use them to predict your wait or order profiles. Ask what public evidence would resolve the question: a matching local timing, a scoped tool-task result or a memory observation at the relevant depth. Until that evidence exists, a decision may still be possible from availability and known limits, but the missing performance claim should remain missing.
Start from the task you need and the Mac you have. Use the catalog and relevant model guide to identify an eligible exact profile, then follow the client guide. Read task evidence for that combination and keep its limits. Use speed evidence to understand a matching performance question, not to promise a completion time. This sequence avoids asking a quality score to answer a hardware question or a decode rate to answer a correctness question.
When you try the chosen setup, inspect the actual task result and preserve the conditions of your own attempt. A successful fictional file exercise establishes that outcome, not a general ranking. If another attempt changes the profile or client, state the change before comparing. Keep links to the original public benchmark and speed rows so that their conditions stay accessible. The decision remains concrete even when some fields are not measured.
When a published row informs your choice, retain its public link and the condition that matters. If the decision concerns generation speed, name that scope rather than a general impression of responsiveness. If it concerns a coding task, retain the task conditions rather than borrowing a nearby throughput value. A missing condition is a reason to narrow the conclusion. You can still make a useful choice from documented availability and limits while leaving an unsupported timing prediction out of it. That is more actionable than combining unrelated results into a single preference.